
 Facebook
 X
X
 Pinterest
 Copy Link

Kelowna Real Estate Market September 2025
Welcome to my Kelowna Real Estate Market September 2025 Report.
August brought a noticeable slowdown in showings, as many buyers and sellers pressed pause to enjoy summer holidays. By the final week, though, momentum began to return with more activity creeping back into the market.
Those stepping forward with offers are doing so with intensity—often negotiating hard after challenging experiences selling their own properties. Layer on the uncertainty surrounding tariffs, and it’s clear that today’s market is demanding both patience and resilience. For sellers, this isn’t a market for the faint of heart.
Kelowna Real Estate Market September 2025 Stats Report
*NOTE: These numbers were reviewed on September 3, 2025, using the Association of Interior Stats and may be subject to minor changes should further sales be reported for August 2025.
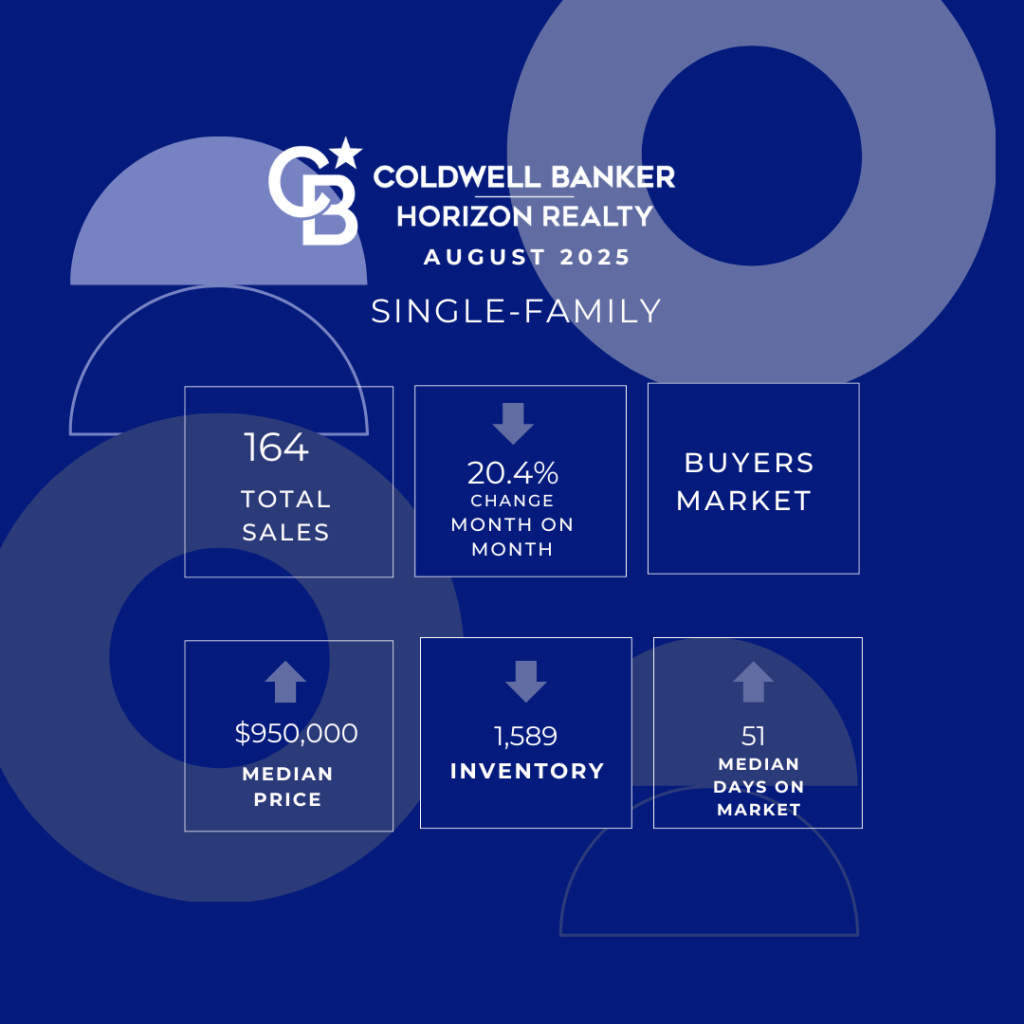

Single-Family Homes August 2025
Home Sales
- August 2025: 164 homes sold.
- Month-over-Month: Down 20.4% from 206 in July 2025.
- Year-over-Year: Up 5.1% from 156 in August 2024.
Median Price
- August 2025: $950,000
- Month-over-Month: Up 1.6% from $935,000 in July 2025.
- Year-over-Year: Up 2.7% from $924,750 in August 2024.
Inventory
- August 2025: 1,589 listings.
- Month-over-Month: Down 5.2% from 1,677 in July 2025.
- Year-over-Year: Down 5.5% from 1682 in August 2024.
Median Days on Market
- August 2025: 51 days.
- Month-over-Month: Up 21.4% from 42 days in July 2025.
- Year-over-Year: Up 4.1% from 49 days in August 2024.
Single-Family Home Takeaways August 2025:
- Sales activity slowed compared to the previous month but remained slightly stronger than last year.
- Prices moved slightly higher than July and above last year’s levels.
- Inventory tightened, with fewer homes available for buyers than in both July and last year.
- Homes are taking longer to sell, with market time stretching compared to both the previous month and last year.
In summary, a tighter supply of inventory, slightly firmer pricing, but a slower pace of sales, which is normal for summer.
Note: The numbers in this post relate to single-family homes only.
Condos August 2025
Condo Sales:
- August 2025: 101 Condos Sold
- Month-over-Month: Down 12.2% from 115 in July 2025.
- Year-over-Year: Up 31.2% compared to 77 in August 2024.
Median Price:
- August 2025: $420,000.
- Month-over-Month: Down 3.9% from $437,000 in July 2025.
- Year-over-Year: Down 2.3% from $430,000 in August 2024.
Inventory:
- August 2025: 896 Listings
- Month-over-Month: Down 7.4% from 968 in July 2025.
- Year-over-Year: Up 19.8% from 748 in August 2024.
Median Days on Market:
- August 2025: 51 Days
- Month-over-Month: Down 19.0% from 63 days in July 2025.
- Year-over-Year: Up 3.8% 53 days in August 2024.
Condos Key Takeaways – August 2025
- Condo sales eased from July, but were stronger than last year.
- Prices softened compared to both the previous month and last year, as Sellers came to grips with the weaker market.
- Inventory tightened month-over-month but remained higher than a year ago, continuing to give buyers more choice.
- Condos sold faster than in July, though still a touch slower than last year.
In summary, condos experienced stronger year-over-year demand, but softer pricing and higher inventory indicate that buyers still have significant leverage.
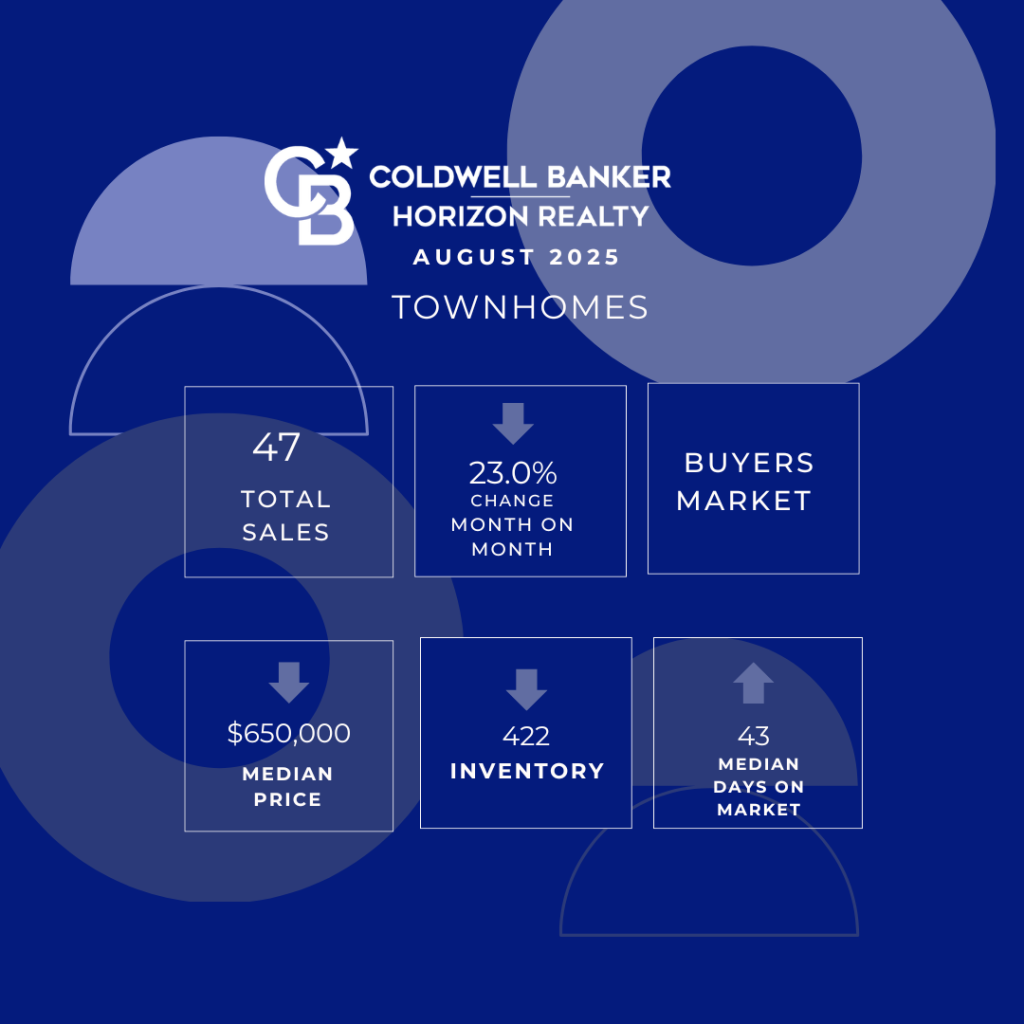
Townhomes August 2025
Townhome Sales:
- August 2025: 47 Townhomes Sold.
- Month-over-Month: Down 23% from 61 in July 2025.
- Year-over-Year: Up 4.4% from 45 in August 2024.
Median Price:
- August 2025: $650,000.
- Month-over-Month: Down 1.5% $660,000 in July 2025.
- Year-over-Year: Down 7.8% from $704,667 in August 2024.
Inventory:
- August 2025: 422 Listings.
- Month-over-Month: Down 5.4% from 446 in July 2025.
- Year-over-Year: Down 4.5% from 468 in August 2024.
Median Days on Market:
- August 2025: 43 Days
- Month-over-Month: Up 13.2% from 38 days in July 2025.
- Year-over-Year: Up 22.9% from 35 days in August 2024.
Townhome Takeaways August 2025:

