
 Facebook
 X
X
 Pinterest
 Copy Link

Kelowna Real Estate Market August 2025
Welcome to my Kelowna Real Estate Market August 2025 Report.
As we ended July & entered August — typically a quieter month in Kelowna real estate — we have been seeing familiar seasonal patterns layered with a healthy dose of uncertainty. With many locals and buyers taking a break, and broader economic concerns still top of mind.
Kelowna Real Estate August 2025 Stats Report
*NOTE: These numbers were reviewed on August 5, 2025, using Association of Interior Stats and may be subject to minor changes, should further sales be reported for July 2025.
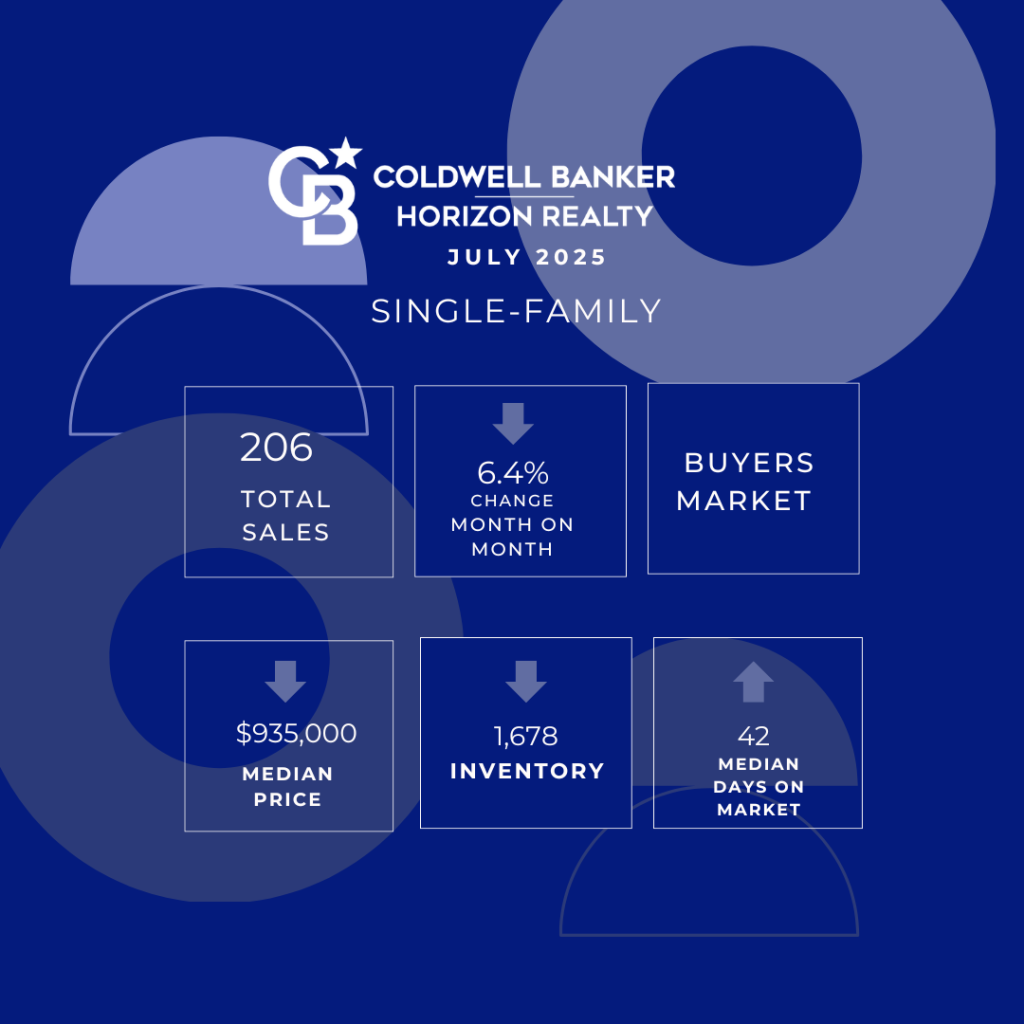

Single-Family Homes July 2025
Home Sales
- July 2025: 206 homes sold.
- Month-over-Month: Down 6.4% from 220 in June 2025.
- Year-over-Year: Up 7.9% from 191 in July 2024.
Median Price
- July 2025: $935,000
- Month-over-Month: Down 6.5% from $1,000,000 in June 2025.
- Year-over-Year: Down 1.7% from $951,000 in July 2024.
Inventory
- July 2025: 1,678 listings.
- Month-over-Month: Down 1.6% from 1,705 in June 2025.
- Year-over-Year: Down 3.3% from 1,735 in July 2024.
Median Days on Market
- July 2025: 42 days.
- Month-over-Month: Up 20% from 35 days in June 2025.
- Year-over-Year: Up 10.5% from 38 days in July 2024.
Single-Family Home Takeaways July 2025:
-
Home sales eased slightly month-over-month but showed modest improvement year-over-year.
-
Prices declined both monthly and annually, suggesting continued pressure on seller expectations.
-
Inventory levels tightened slightly, signalling some sellers may be holding off for better conditions.
-
Homes are taking longer to sell, indicating cautious buyer behaviour and slower decision-making.
Note: The numbers in this post relate to single-family homes only.
Condos July 2025
Condo Sales:
- July 2025: 115 Condos Sold
- Month-over-Month: Up 23.7% from 93 in June 2025.
- Year-over-Year: Down 1.7% compared to 117 in July 2024.
Median Price:
- July 2025: $437,000.
- Month-over-Month: Up 2.0% from $428,500 in June 2025.
- Year-over-Year: Down 2.9% from $450,000 in July 2024.
Inventory:
- July 2025: 970 Listings
- Month-over-Month: Down 0.9% from 979 in June 2025.
- Year-over-Year: Up 23.4% from 786 in July 2024.
Median Days on Market:
- July 2025: 63 Days
- Month-over-Month: Up 40% from 45 days in June 2025.
- Year-over-Year: Up 40% 45 days in July 2024.
Condos Key Takeaways – July 2025
-
Condo sales saw a strong monthly rebound but remained slightly below last year’s pace.
-
Prices edged up from June but are still trending lower compared to the same time last year.
-
Inventory levels remain elevated year-over-year, adding to buyer choice and competition among sellers.
-
Days on market increased sharply, pointing to slower absorption and more cautious buyer behaviour.
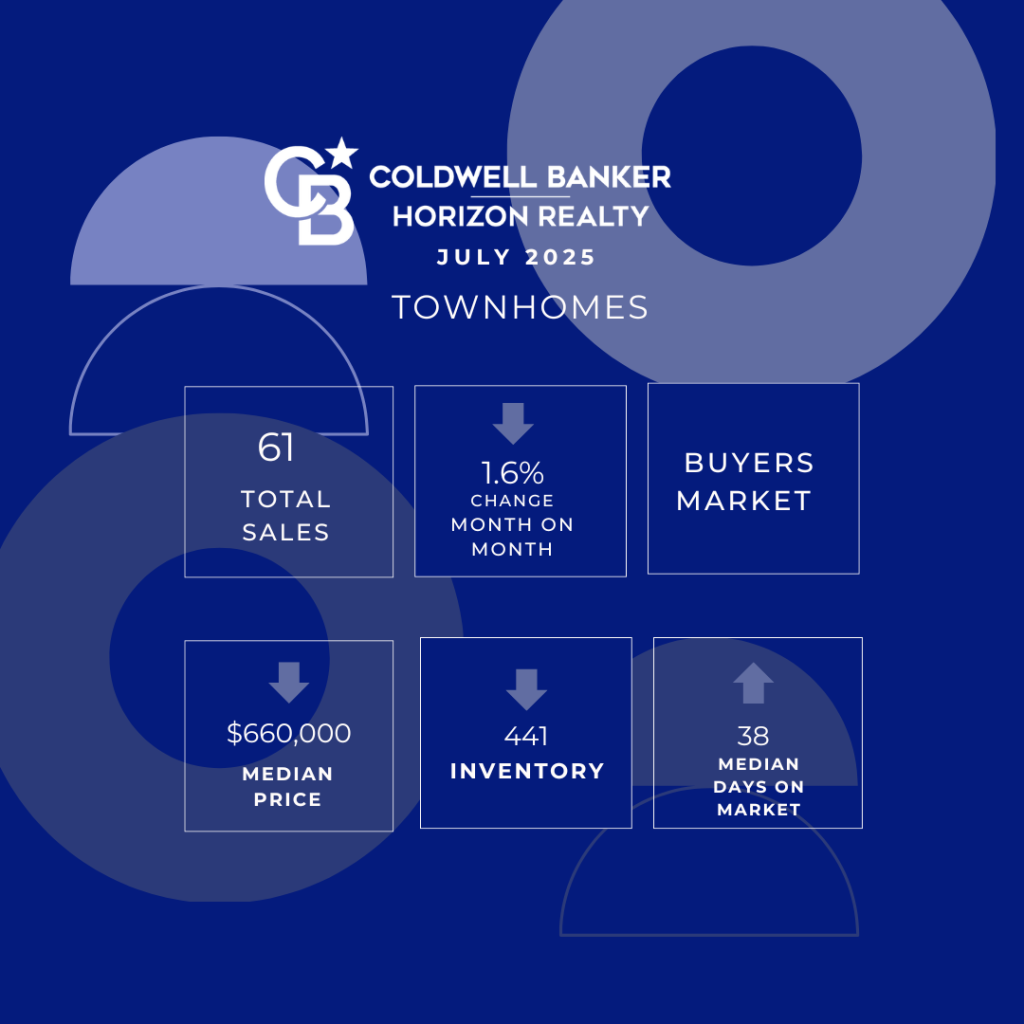
Townhomes July 2025
Townhome Sales:
- July 2025: 61 Townhomes Sold.
- Month-over-Month: Down 1.6% from 62 in June 2025.
- Year-over-Year: Down 3.2% from 63 in July 2024.
Median Price:
- July 2025: $660,000.
- Month-over-Month: Virtually the same $660,500 in June 2025.
- Year-over-Year: Down 3.6 % from $685,000 in July 2024.
Inventory:
- July 2025: 441 Listings.
- Month-over-Month: Down 0.9% from 445 in June 2025.
- Year-over-Year: Down 5.8% from 468 in July 2024.
Median Days on Market:
- July 2025: 38 Days
- Month-over-Month: Up 5.6% from 36 days in June 2025.
- Year-over-Year: The same at 38 days in July 2024.
Townhome Takeaways July 2025:

